Using Visualizing Health
Visualizing Health is a style guide that is intended to serve as both inspiration and instruction to health professionals and others seeking to communicate health risk information to the public.
The graphic visualizations on this site are more than just attractive designs: they have been scientifically tested with real users. Our hope is for this information to be used far and wide, and that what we’ve learned will help make it a little easier for health professionals to explain complicated concepts to those people who need to understand it.
Visualizing Health contains a lot of good ideas about how to present health data – but this site is only a start. We encourage researchers, designers, and other professionals to continue building on what we’ve learned. One clear lesson from this project is that when it comes to presenting health information, there is no single “best” graphic. Different goals require different designs, and graphics that performed well in our testing may not always be the best choice to accomplish the things that matter most to you.

Vizhealth Adventures
See how Melanie—top educator at the Diabetes Center of the Universe—makes the best use of the images in Visualizing Heath to help her patients. Read the Comic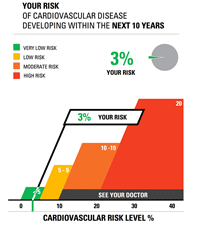
Risk Calculator
How would you use one of our images to show patients their potential risk? Enter some demographic data into our risk calculator and find out how the images change based on your patients’ data.How to Choose an Image
The easiest way to choose an image is to use the Wizard, which can filter the visualizations library according to your needs. It is also possible to see and filter the full library of images using the Gallery.
How to Adapt an Image
All of the gallery images on this site are available for widespread use through a creative commons license. You are free to duplicate, adapt, and modify the images as you see fit—we just ask that you abide by the Creative Commons Attribution terms. That means you should give credit to Vizhealth.org, and provide a link to our copyright and licensing information with a note about whether you made any changes.
How to Attribute Use
Please use this language when using an image you’ve adapted from our site:
This [image/chart/graph/etc.] is based on original research and designs from Visualizing Health, a collaborative project between the University of Michigan and the Robert Wood Johnson Foundation made publicly available via Creative Commons license. Our use of this image should not be considered an endorsement from Visualizing Health. For more information, visit www.vizhealth.org.
How to Provide Feedback
We developed these images to address what we believe is a widespread need for guidance on communicating health information visually. But we know this is just a start. We are eager to learn what people do with these images, and how adequately they meet various needs. Please let us know what you’ve done with images by sending us an update here vizhealth@rwjf.org. We are also ready to answer questions you may have; you can send those here vizhealth@rwjf.org.